Modelling, Simulation and Testing of automotive perception sensors
Sim4CAMSens is a CCAV funded project working on methods to quantify and simulate camera, radar and lidar sensor performance under all conditions.

Design of the test range and targets
When designing the test range we had to consider a number of factors that influenced the selection of the location, layout and design of the individual targets as well as the housing needed for the sensors and data loggers. If you’re not familiar with the background to this test campaign, see the previous blog posts on our blog, The Sandbox.
As the Sim4CAMSens project is funded by Innovate UK it was decided that, at least this year, the test location should be within the UK. As a result of this and our desire to collect data when it is snowing, we selected a location in the Scottish Highlands for our test site. The site selected is a relatively flat featureless field that allowed us to then design a suitable test range. Keeping the test site within the UK also eased some of the logistical challenges involved in setting this up and solving the many problems that occurred during the site preparation, build and operation.
The main purpose of this test programme is to explore how the performance of AV perception sensors is affected by winter weather conditions. For this reason, we have installed multiple cameras, lidars, radars and thermal imaging sensors at the test site. There are 4 different cameras with 3 different CMOS chips, 5 different lidar covering 850nm, 905nm and 1550nm wavelengths, 5 different radars all operating within the automotive 77-79GHz band and a thermal imaging camera.
The basic layout of the test range is straight forward with the sensors located at one end of the field, closest to the power supply and a series of targets placed at different distances across the field. The layout of the targets was designed to keep them within ±10 degrees azimuth – the main driver for this being to try and ensure that the targets are within the main lobe of the radar sensors.
One aspect of the sensor performance that we are interested in investigating is the effect of range combined with the weather, so several targets are located at different distances within the test range. The closest target is 10m from the sensor housing with the furthest one located 80m away. The layout of the range was then determined to ensure no overlap between the targets when viewed from the sensor housing and to also ensure there was a clear separation of the targets when viewed from the sensor housing, see Figure 1. Figure 2 shows the test site as constructed.
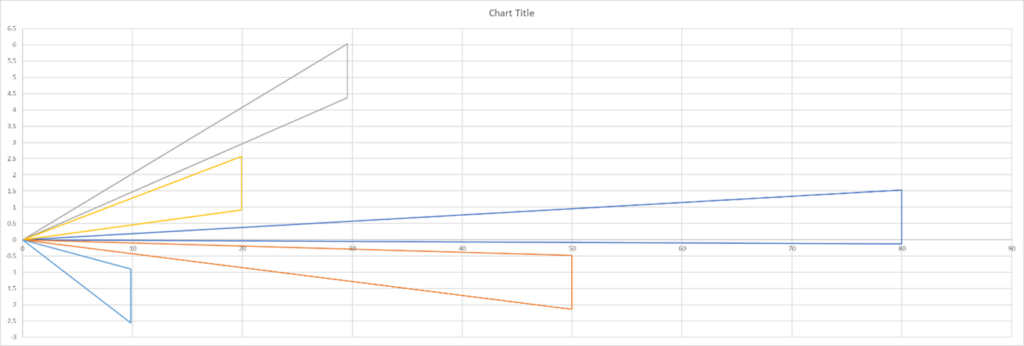
Figure 1: Range layout with sensors located at the left hand end and the triangles representing the sight lines to the target locations at 10m, 20m, 30m, 50m and 80m. This was used to ensure the sight lines to the targets didn’t overlap by adjusting their offset from the centre of the range.
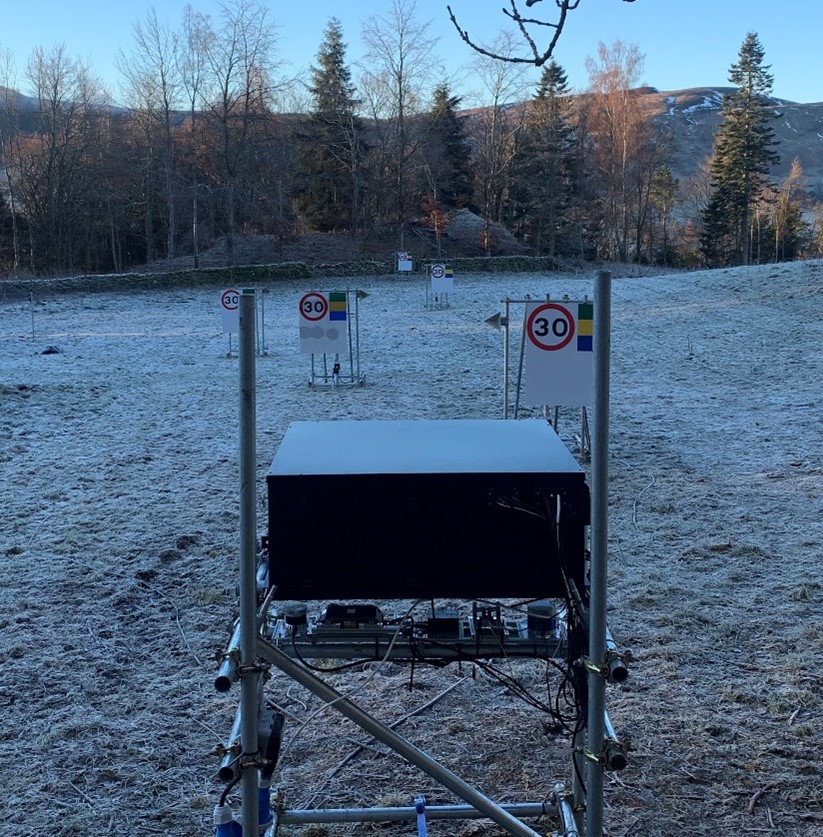
Figure 2: View of the test site with the sensor housing in the foreground and the targets across the range on a cold frosty morning.
The design of each target was conceived to ensure that there was an appropriate part for each sensor to look at. For the radars, a trihedral corner reflector (CR) with a high RCS of 19 dBsm at 79 GHz was incorporated into the design to provide a strong, focused single path return to the radars. The CRs are installed ~1.7 m above the ground to reduce the multipath effect caused by ground. The grass in the field has also been cut short to reduce the multipath effect caused by grass on the radar sensors. The CR’s used are the same as those at NPL’s Cardington test site.
For the cameras and lidars a large sign was designed and built to the established UK road sign standards. The graphical design of this sign incorporates a standard UK 30mph speed limit sign at the top left with 3 colour bands next to it. The colour bands are the same colours used on UK road signs to provide instructions and important information to drivers. The bottom half of the road sign is left blank to have a large area for the lidar sensors. At most of the target stations the signs use a non-reflective coating but on the 20m target the sign has a retro-reflective coating (class RA2 as defined by BS EN 12899-1:2007 and BS 8442).
To ensure consistency in the measurements between this test site and the existing work NPL have been doing at their Cardington test site, we have used several of the same targets. In addition to using the same radar corner reflectors, we have incorporated several of the camera and LiDAR targets designed by NPL. In Figure 3, we see one of the NPL camera SFR targets with grey scale squares.
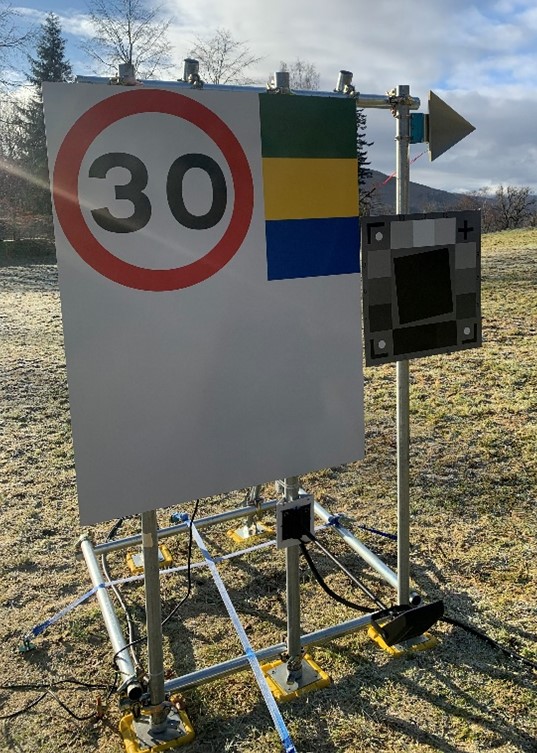
Figure 3: Target at 30m. The large panel on the left-hand side is manufactured as a standard UK road sign with a 30mph speed limit and colour bands that are used on UK road signs. The large white area provides a consistent area for the lidar measurements to focus on. There is a radar corner reflector at the top right of the target. The set of squares on the right-hand side panel is the same target used by NPL at their Cardington test site and is included to provide a way to align results between the different test locations.
Due to the test location being in a rural area, it was necessary to light the signs at night otherwise the cameras would not be able to see anything. The light can be seen below the sign in Figure 4. The night time ambient light levels in this rural location are very low and without lighting we would only have had useful camera data between 8am and 4pm rendering most of the day’s camera data useless. With lighting, the cameras can capture data 24 hours a day provided their exposure control is able to adjust well enough between bright daylight and night-time.
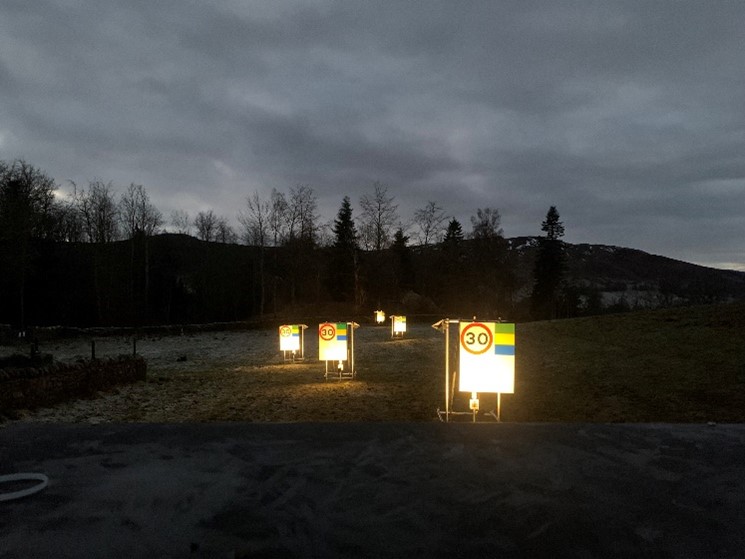
Figure 4: Targets illuminated at night.
We also tried to heat the signs to prevent the build-up of frost, snow and ice on the target surfaces. The idea was to ensure that we focused on measuring the effect of weather in the atmosphere without including changes in the target surface. Unfortunately, the heating method used this year was not fully effective and has led to clear patches and heavily frosted parts of the signs as can be seen in Figure 5. It has been effective on the radar reflectors though and these remain clear of frost even on the coldest nights. As a result, the radar reflector on the 10m target location has been setup without a heater to allow us to investigate if this is a significant factor that needs to be investigated further in future test campaigns.
Figure 5: Clear and frosted areas on the targets as a result of the heating system not performing as well as expected.
Please get in touch if you have any questions or have got a topic in mind that you would like us to write about. You can submit your questions / topics via: Tech Blog Questions / Topic Suggestion
Project Updates
All the latest news, updates and information from our project partners.

Perception sensors under test
When developing the winter test programme, a key consideration was to make sure that we could capture data from a ...
Design of the test range and targets
When designing the test range we had to consider a number of factors that influenced the selection of the location, ...

Weather measurements for the winter test campaign
When designing the Sim4CAMSens Winter testing campaign, as with any real world test work, one of the key concerns ...